Looking for Support and Resistance? Price Channels Might Help
David Russell
February 14, 2023
Traders often use support and resistance to get an edge in the stock market. However levels can change as prices move, so today we’ll consider a tool that automatically adjusts as trends evolve: price channels.
TradeStation’s Price Channel indicator tracks recent highs and lows over a certain number of trailing bars. This can highlight where a stock recently bounced or peaked, helping traders see potential support or resistance levels.
Price channels may be especially useful on intraday charts of stocks in short-term uptrends. Consider the examples below of Boeing (BA), Alibaba (BABA) and Exxon Mobil (XOM), which each pushed higher since later November.
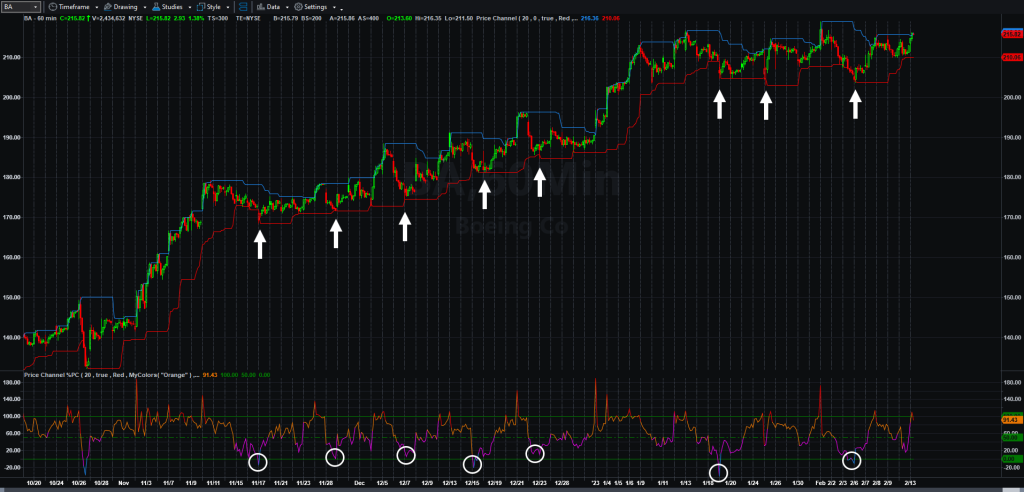
Boeing Hourly Price Channels
Boeing (BA), hourly chart with Price Channel and Price Channel %PC indicators. Arrows show where prices bounced at the recent lows. Circles show where the %PC indicator hit oversold conditions.
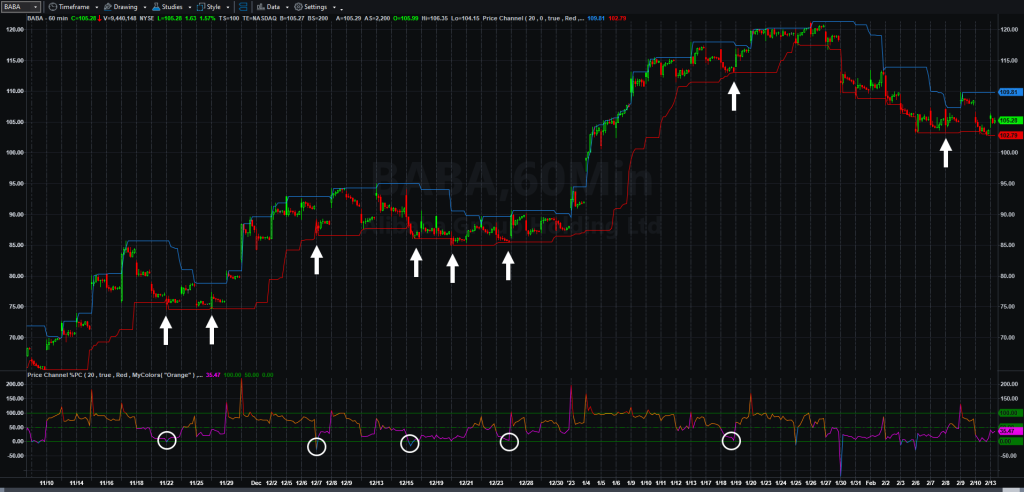
Alibaba Hourly Price Channels
Alibaba (BABA), hourly chart with Price Channel and Price Channel %PC indicators. Arrows show where prices bounced at the recent lows. Circles show where the %PC indicator hit oversold conditions.
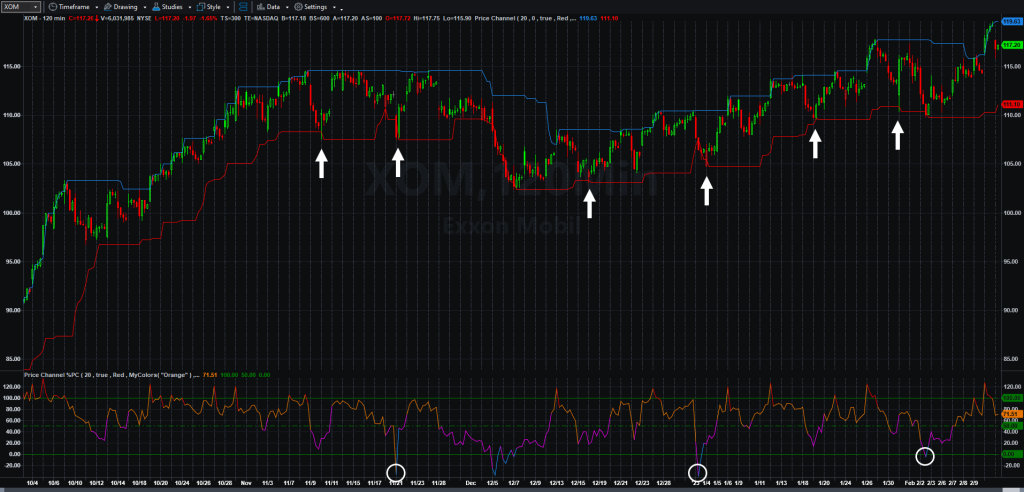
Exxon 2-Hour Price Channels
Exxon Mobil (XOM), two-hour chart with Price Channel and Price Channel %PC indicators. Arrows show where prices bounced at the recent lows. Circles show where the %PC indicator hit oversold conditions.
Using Price Channel Indicator
By default, TradeStation’s Price Channel indicator tracks highs and lows over the last 20 price bars. (This can be adjusted as explained below.) It will use the interval of the chart in question, so two-hour bars will show longer-term price ranges.
Price Channel might help traders wait for stronger support levels because they will only highlight potential entries at proven lows. Likewise, they will only highlight resistance at established highs.
Traders may also want to focus on stocks in detectable trends. This recent post shows some potential techniques for discovering such companies.
Different stocks may follow different price channels. Faster movers, for example, may fluctuate within 15-minute or even 5-minute price channels. Traders may want to consider adding Price Channel to their charts and then changing intervals to discover which corresponds best to price action.
The screenshots above also have the related indicator Price Channel %PC as lower studies. This shows where a stock’s price lies within the the trailing range. Lower values may reflect “oversold” conditions, or potential entries. Higher values may reflect “overbought” conditions, when prices are near the top of the channel.
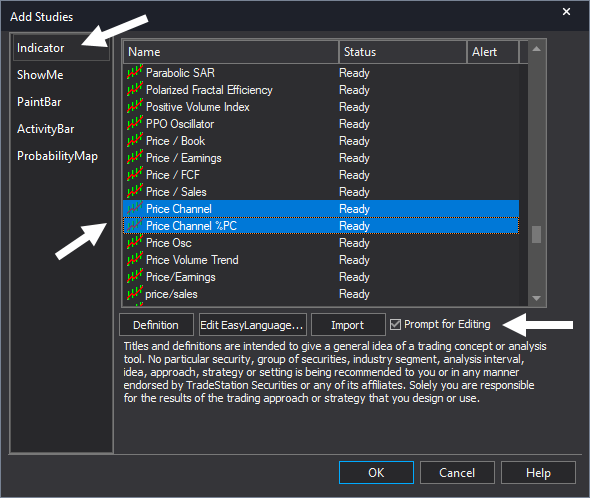
Add Studies dialog box for Chart Analysis. Notice how the Indicator tab and the Prompt for Editing box are selected.
Adding Price Channel to Charts
To add Price Channel and Price Channel %PC to a TradeStation chart, follow these steps:
Click on Studies → Add Study …
A dialog box will appear.
Make sure the left tab is set to “Indicator.”
Scroll down and select Price Channel.
Holding down the “Ctrl” key, click on Price Channel %PC.
Make sure the “Prompt for Editing” box is checked under the list.
Click OK
This will bring up Customize boxes for both indicators. Here are some potential adjustments via the navigation tabs on the left:
Inputs: Change the length of time referenced. It’s set to 20 bars by default, but you can change this with the “Length” input.
Style: Lets users change thickness for the upper and lower bands.
Color: The upper band is blue by default and the lower band is red. Users can alter those settings here.
Remember, you can always change the price interval by clicking the Timeframe menu on the top left of the chart. You can also adjust the settings on Price Channel by right clicking on it or navigating through Studies → Edit Studies in the menu bar.
Using Price Channel With RadarScreen
Adding Price Channel to a chart assumes traders already have a stock in mind that they wish to buy or sell. But what if they’re looking for potential opportunities or monitoring a list of securities? In this case, RadarScreen may come in handy.
RadarScreen can be accessed via the Apps menu at the top of the workspace or by typing “Ctrl-Alt-Q.” Here are some potential next steps:
Add a list of stocks you may want to trade.
Click on Studies → Add Study…
A dialog box will appear.
Make sure the left tab is set to “Indicator”
Scroll down and select Price Channel
There’s no need for Price Channel %PC on RadarScreen
Adjust it the same way as explained above for charts.
Clicking on the “%P” column will sort the list, toggling between the most overbought and most oversold symbols.
Note: RadarScreen typically defaults to five-minute candles. To change the price interval, click on the Symbol column to select all symbols. Then adjust using the Timeframe menu.
In conclusion, buying low and selling high is a basic goal of trading. This is seldom as easy as it sounds because of emotion and confusion about key levels. While no single indicator ensures success, Price Channel may be a useful tool to help traders follow trends and avoid premature entries and exits.
David Russell is Global Head of Market Strategy at TradeStation. Drawing on nearly two decades of experience as a financial journalist and analyst, his background includes equities, emerging markets, fixed-income and derivatives. He previously worked at Bloomberg News, CNBC and E*TRADE Financial.
Russell systematically reviews countless global financial headlines and indicators in search of broad tradable trends that present opportunities repeatedly over time. Customers can expect him to keep them appraised of sector leadership, relative strength and the big stories – especially those overlooked by other commentators. He’s also a big fan of generating leverage with options to limit capital at risk.
TradeStation’s platform is known for letting customers build their own tools. It also provides a series of calculated indexes for advanced technical analysis. Today's article will cover some of these indicators, which may be especially useful for assessing market...
RadarScreen™ is one of TradeStation's most powerful tools. If you're new to our platform here are some basics to get you started with this versatile application. What Does RadarScreen Do? First, what does it do? RadarScreen is a customizable grid that can track and...
The stock market is bouncing after a dip. Are any companies stabilizing as sentiment recovers? Today's article will consider a method for discovering potential opportunities. It uses TradeStation's EasyLanguage scripting tool to create a custom indicator, which can...
Leaving TradeStation
You are leaving TradeStation.com for another company’s website. Click the button below to acknowledge that you understand that you are leaving TradeStation.com.
You are leaving TradeStation.com for CrossroadsSummit.com, an exciting new conference that highlights opportunity at the intersection of chaos and innovation. Click the button below to acknowledge that you understand that you are leaving TradeStation.com.
This event is hosted on YouCanTrade. The information for this event is being provided for informational and educational purposes only.
You are leaving TradeStation Securities and going to YouCanTrade. YouCanTrade is an online media publication service which provides investment educational content, ideas and demonstrations, and does not provide investment or trading advice, research or recommendations. YouCanTrade is not a licensed financial services company or investment adviser and does not offer brokerage services of any kind.
TradeStation Securities, Inc. provides support and training channels hosted on YouCanTrade, its affiliate. Other than these support and training channels, any services offered by YouCanTrade are not sponsored, endorsed, sold or promoted by TradeStation Securities and it makes no representation regarding any YouCanTrade goods or services.
To acknowledge you are leaving TradeStation Securities to go to YouCanTrade, please click
This website uses cookies to offer a better browsing experience and to collect usage information. By browsing this site with cookies enabled or by clicking on the "ACCEPT COOKIES" button you accept our Cookies Policy. To block, delete or manage cookies, please visit your browser settings. Restricting cookies will prevent you benefiting from some of the functionality of our website.ACCEPT COOKIES